Sioux City sits at an elevation of roughly 1,200 feet on a landscape shaped by the Missouri River and Pleistocene glaciation, where thick loess deposits drape the underlying Cretaceous bedrock. In the hills north of downtown, loess thickness can exceed 50 feet, creating sharp velocity contrasts that seismic tomography captures with exceptional clarity. Our team combines P-wave and S-wave refraction with high-resolution reflection profiling to image these transitions, mapping the contact between weathered shale, competent limestone, and the overlying silts. For projects along the riverfront, where alluvial sands and buried paleochannels complicate foundation design, we deploy dense geophone arrays that resolve lateral velocity changes at the scale needed for precise excavation planning. When a Des Moines Lobe till sheet is suspected beneath fill or when bedrock rippability must be forecast before a mass grading contract is let, seismic refraction serves as the primary reconnaissance tool, and we integrate results with resistivity profiling when clay-rich horizons produce ambiguous velocity signatures. The output is a 2D or 3D tomogram that engineers can load directly into their geotechnical model, replacing guesswork with measured P-wave velocity gradients that correlate with standard penetration resistance and modulus values established in regional practice.
In Sioux City's loess-blanketed terrain, a 3,000 fps velocity contour on a refraction tomogram often maps the boundary between collapsible silt and competent glacial till with remarkable precision.
Methodology and scope
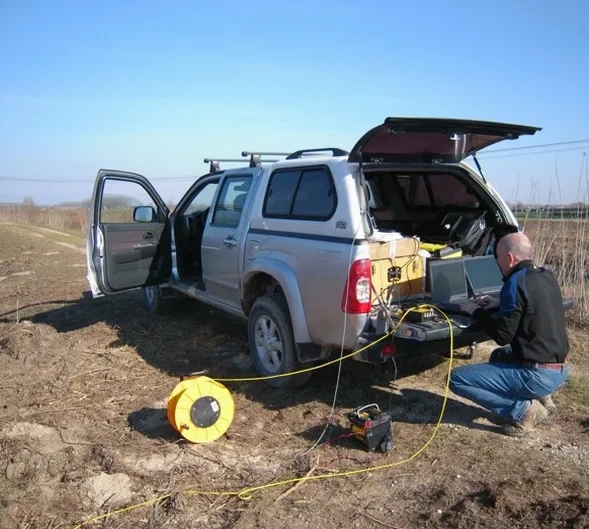
The field setup we deploy around Sioux City typically involves a 24- or 48-channel seismograph connected to a spread of 4.5 Hz vertical geophones planted at 5 to 10-foot spacing, depending on the target resolution. We generate a seismic pulse using a sledgehammer on an aluminum strike plate for shallow refraction work, switching to an accelerated weight drop or a small explosive charge when we need to image deeper than 100 feet—common when mapping bedrock basins beneath the Missouri River alluvium. The raw shot gathers are processed through tomographic inversion algorithms that iterate thousands of ray paths through a velocity model until observed and calculated travel times converge. What makes this particularly effective in Sioux City's loess terrain is the strong velocity gradient: dry loess transmits P-waves at roughly 1,000 to 2,000 feet per second, while saturated loess or dense glacial till jumps to 4,000 to 6,000 fps, and competent limestone exceeds 12,000 fps. Those contrasts produce clear refraction arrivals that our processing software unravels into detailed subsurface images. For projects requiring shear-wave velocity profiles to comply with IBC site classification, we run MASW surveys along the same transects, and the combined dataset feeds directly into site-specific ground motion analyses. When reflection profiling is warranted—usually for mapping subtle stratigraphic traps in deeper sedimentary layers—we use a 24-channel spread with higher-frequency geophones and a common-midpoint stacking routine that suppresses ground roll while enhancing primary reflectors from depths beyond 200 feet.
Local ground factors
The seasonal freeze-thaw cycle in northwest Iowa introduces a timing challenge for seismic surveys that many project schedules overlook. From November through March, frozen ground in the upper 12 to 18 inches creates a high-velocity lid that distorts first-arrival picks and biases the inverted velocity model toward unrealistically stiff near-surface values. We mitigate this by scheduling refraction work between April and October whenever possible, or by drilling shallow pilot holes through the frozen crust to plant geophones below the frost line when winter surveys are unavoidable. A more persistent concern is the saturated loess condition that develops after heavy spring rains: when moisture content approaches the liquid limit, P-wave velocity drops into the 800 to 1,200 fps range and the signal attenuates rapidly, reducing the effective depth of investigation. In these conditions we increase the energy input, tighten the geophone spacing, and stack multiple hammer blows per shot point to improve the signal-to-noise ratio. The presence of buried concrete rubble in former industrial parcels along the Floyd River corridor—remnants of stockyards and packing plants that operated for decades—generates scattered arrivals that can mimic a bedrock reflector, a pitfall we address by cross-checking refraction interpretations against available boring logs and historical Sanborn maps.
Common questions
How deep can seismic refraction see in Sioux City's loess terrain?
The practical depth of investigation depends on the spread length and the velocity structure, but a rule of thumb is roughly one-fifth to one-quarter of the total spread length. With a 470-foot geophone spread, we typically image to depths of 90 to 120 feet in the loess-and-bedrock setting that dominates the hills around Sioux City. In saturated alluvium along the Missouri River, the effective depth may be somewhat shallower—often 70 to 90 feet—because the lower-velocity saturated sediments absorb more seismic energy. For targets deeper than 120 feet, we switch to reflection profiling with a longer offset and a more powerful source, which can resolve layering down to 300 feet or more.
What is the typical cost range for a seismic tomography survey in the Sioux City area?
For a standard 2D refraction tomography line with 24 to 48 geophones and a survey length of 300 to 500 feet, the cost generally falls between US$2,590 and US$5,910 depending on the number of spreads, the accessibility of the site, and whether we combine the refraction work with MASW or reflection profiling. A typical single-line survey for bedrock mapping on a residential or light commercial lot in Woodbury County will be toward the lower end of that range, while a multi-line survey with reflection processing for a larger commercial development near the riverfront will approach the upper end.
Can seismic tomography detect voids or old tunnels in Sioux City?
Yes, under the right conditions. Air-filled voids produce a strong velocity contrast—P-waves cannot propagate through air—so a void appears as a low-velocity anomaly or a zone of missing first arrivals on a refraction tomogram. However, the void must be large enough relative to the geophone spacing to be resolved; a cavity smaller than roughly one-tenth of the geophone interval will be invisible. In Sioux City, where historic underground utilities and abandoned coal mine entries exist in some older neighborhoods, we often combine seismic tomography with electrical resistivity imaging to cross-check anomalies, since an air-filled void will show both a seismic velocity deficit and a high-resistivity signature.